October 21, 2026 · 4 min read
Drawing the next twelve hours
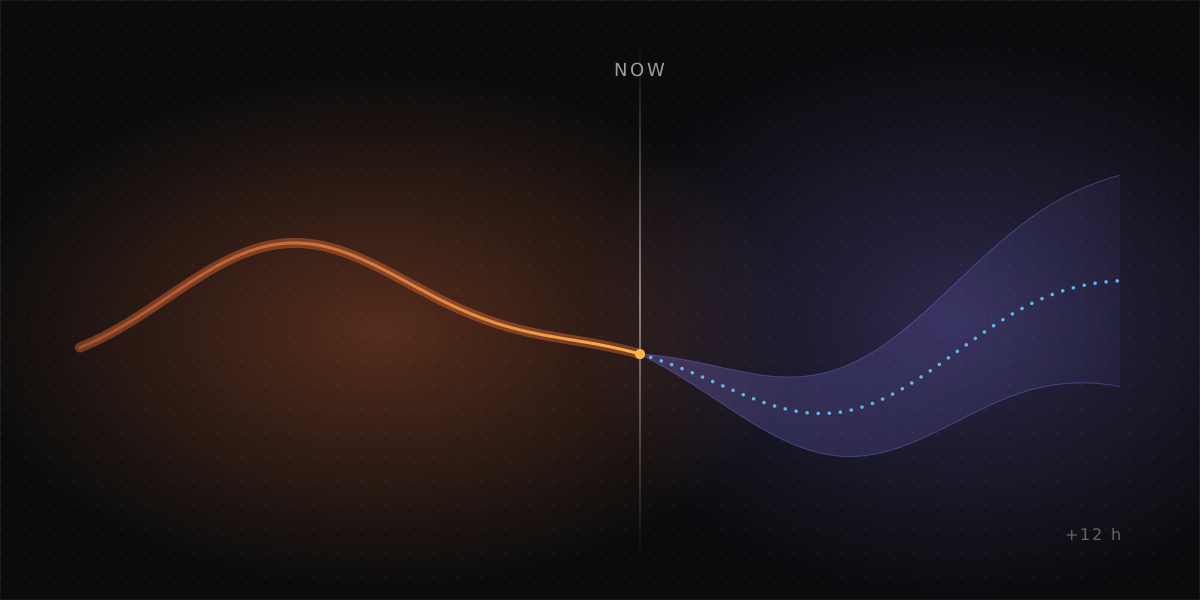
My heating panel only shows the past, so a cold morning shows up after it happens. The plan is to draw twelve hours ahead, with each line drawn only as confidently as it deserves.
An idea in progress. It builds on Teaching the floor to start early.
My radiant floor has a panel in Home Assistant with charts for the room, the two water loops, power and daylight. Every chart ends at the right edge, which is now. That is the wrong place to stop. The questions I actually have are about the next few hours: will the room hold overnight, will the floor start early enough, will it reach 71.5°F by 6 AM? Right now I find out the next morning.
So the idea is to extend the charts twelve hours to the right of a vertical "now" line, with everything predicted drawn dotted. It sounds like one feature. It turns out to be three, because the future isn't equally knowable.
Three kinds of future
Known. Some of the next twelve hours is just the schedule. The target temperature holds Comfort until 10 PM, drops to Eco and comes back at 4 AM. Nothing has to be predicted. It only has to be drawn.
Borrowed. The outside temperature comes from the weather forecast. I don't make it, I just show it. It is usually close for the next few hours and less reliable after that, and I can't make it better.
Predicted. The room temperature, and when the pumps will run, are what I actually want to see. They're also the only part that needs a model. The room depends on how much heat is stored in the slab, how cold it is outside and when the thermostat calls for heat. The thermostat in turn depends on the room.
The plan treats these three differently, and builds them in that order.
Phase one: the parts that are already known
The first version draws only what isn't a guess: the scheduled target ahead of now, and a new outside card with the hourly forecast as a dotted line.
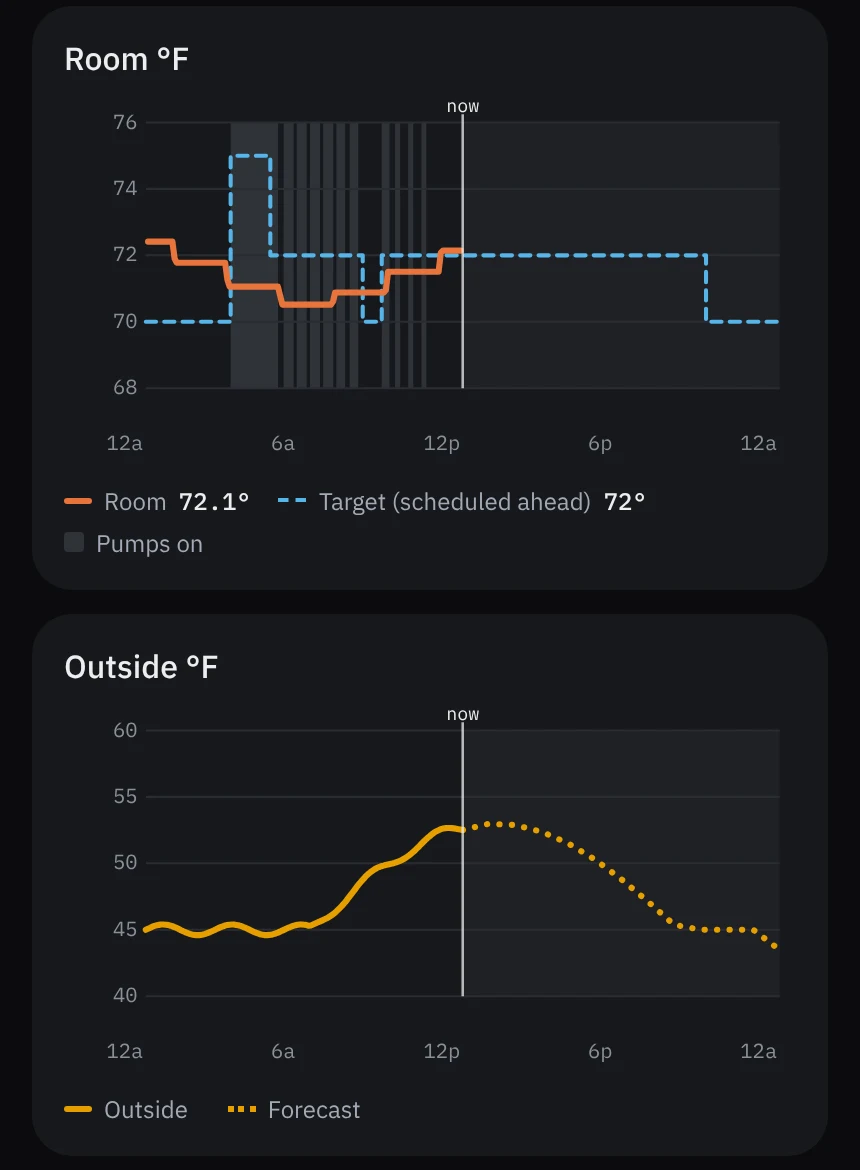
That is a mockup, not the finished panel. It is the real card, modified and rendered with one morning's real room data, frozen at 12:47 PM. The outside curve in it is sample data shaped like a mild October day.
The mockup changed the plan. My first version extended every chart. The heater loop, the floor loop and power were half empty, twelve hours of blank space past the now line, because phase one has nothing to put there. Blank space reads as missing data. Now only the room and outside charts extend. The rest keep showing history until there is something worth drawing ahead.
Phase two: predicting the room
The model doesn't need to be clever. A room heated by a slab can be treated as a few connected bodies of heat:
- the slab gives heat to the room in proportion to how much warmer it is;
- the room loses heat to the outside in proportion to how much colder it is out there;
- when the pumps run, the slab gains heat.
Each of those has one number to fit. The data to fit them already exists: the slab probes from the slab experiment log the slab's temperature every night, next to the room and outside temperatures. With those numbers, the next twelve hours can be stepped forward a few minutes at a time. The forecast supplies the outside. The schedule supplies the target. A copy of the thermostat's logic decides when the pumps would run.
That produces a dotted room line, with a shaded band around it for the uncertainty, and hatched bands for the heat calls it expects. The band should widen toward the right edge, because errors compound.
This is the same model the slab experiment needs to choose a morning start time. One model serves both: if it can predict the room at 6 AM, it can also say when to start.
A line has to earn its dots
A dotted line on a chart looks like knowledge. If it's wrong, it is worse than no line, because I'll plan around it. So the prediction has to pass a test before it is shown:
- Every prediction is saved when it is made.
- The next morning the climate engineer, the scheduled agent that reviews the heating every day, compares the prediction with what happened.
- The comparison is against the laziest possible forecast: tomorrow morning looks like this morning.
- The predicted line appears on the panel only if, over 14 mornings, it is within 0.5°F at 6 AM and beats the lazy forecast on at least 10 of them.
If the model can't beat "same as yesterday", it isn't telling me anything, and the panel stays as it is. That is a real possibility. Fourteen mornings of grading is cheap compared with trusting a line that's quietly wrong.
What I'm leaving out
The loop temperatures and pump power could be predicted too. I'm not going to. They swing quickly, they mostly follow from the heat calls, and a dotted line through them would be clutter that tells me nothing new. If phase two works, the hatched heat-call bands carry that information already.
The forecast is also computed in Home Assistant and stored as a sensor, not worked out in the browser. That makes the saved predictions and the morning grading possible, and keeps the card a drawing tool.
Where it stands
The idea went from one sentence to an approved work order the same day, the way changes go through the house's engineering staff. Phase one is approved and with the climate engineer. Phase two is two weeks of measurement before anything appears on the panel.
I'll write up phase two once it has been graded, whether or not the model passes.